
In a dense urban environment like Los Angeles, traffic crashes are a daily reality and car accident statistics are on the rise because of this. Understanding where, when and why collisions occur helps policymakers improve safety and helps injured victims pursue justice.
Below is a data‑driven look at crash volumes, injury counts, fatality trends, time‑of‑day patterns and the most dangerous intersections in Los Angeles. If you or a loved one has been injured in a crash, call us at (213) 351‑3513 for a free consultation. Our attorneys are ready to help.
How Many Car Crashes and Injuries Are Happening in Los Angeles?
Los Angeles County collects crash data through the Transportation Injury Mapping System (TIMS) maintained by the California Department of Transportation. Because official statistics for 2025 and 2026 have not yet been released, the most recent full year is 2024, with comparable data shown back to 2020.
This period captures the pandemic dip and the rebound that followed.
According to TIMS data, 58,659 crashes causing death or injury occurred in Los Angeles County in 2024. This was roughly the same as 2023 (58,728) and 2022 (58,147).
For every injury‑causing crash, there are roughly 1.4 injured people, meaning tens of thousands of crash injuries occur annually.
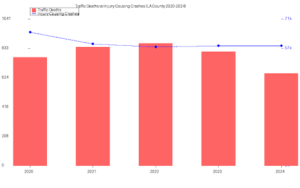
Traffic deaths vs. injury‑causing crashes (2020‑2024)
The chart below contrasts traffic deaths with the number of crashes causing death or injury for each year.
Traffic deaths peaked in 2022 at 868 and fell to 653 in 2024. Despite the decrease, the number of injury‑causing crashes has remained stubbornly high.
Key Takeaways:
- 2022 was the deadliest recent year, with 868 traffic deaths and 58,147 injury‑causing crashes.
- 2024 saw significant improvement, with traffic deaths dropping to 653 and injury‑causing crashes essentially flat.
- Traffic deaths remain far higher than pre‑pandemic levels; the city recorded more than 300 traffic deaths each year since 2022.
Injury Counts: Who Gets Hurt?
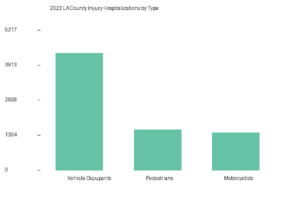
Crash injury data reveals the human cost behind the numbers. The 2022 Los Angeles County injury data illustrates the breakdown by road‑user type. In 2022, the county recorded 8,168 hospitalizations due to motor‑vehicle crashes, including 4,348 hospitalized vehicle occupants, 1,503 pedestrians and 1,385 motorcyclists. There were 69,987 emergency‑department visits related to crash injuries.
Why these numbers matter:
- Vehicle occupants account for roughly half of hospitalizations.
- Pedestrians and motorcyclists suffer disproportionately severe injuries. Many of the 1,503 hospitalized pedestrians were victims of hit‑and‑run crashes.
- ER visits far outnumber hospitalizations, showing that many injuries are treated and released, yet even “minor” injuries can lead to long‑term pain, lost work, and medical bills.
If you were injured as a pedestrian, cyclist, motorcyclist or vehicle occupant, Cha Cha Cha Law can help you pursue compensation. Call (213) 351‑3513 for a free case review.
Number of Fatal Car Accident Deaths in Los Angeles, California
The City of Los Angeles experienced 336 traffic deaths in 2023, including 179 pedestrians. Fatal collisions increased 8% from 2022, while fatal hit‑and‑run crashes surged 23%, causing 106 deaths.
Preliminary city data for 2024 shows that traffic deaths declined to 302, a 12.5% drop from 2023. Nevertheless, the number of deaths still exceeded the city’s homicide count and remained above pre‑pandemic levels. About 170 pedestrian deaths were recorded in 2024.
County statistics and road‑user breakdown
At the county level, the 1,059 deaths recorded in 2022 underscore the region’s road‑safety crisis. County data for 2024 report 653 traffic deaths.
Breakdown of 2024 fatalities by road‑user type:
| Road‑user type | Fatalities (2024)* |
|---|---|
| Pedestrians | ~260 pedestrians died in LA County |
| Cyclists | 22 cyclist deaths |
| Motorcyclists | 78 motorcyclist deaths |
| Vehicle occupants & others | Remainder of the 653 deaths |
These figures show that pedestrians remain the most vulnerable road users, accounting for roughly 40% of traffic deaths. Many fatal pedestrian crashes involve hit‑and‑run drivers. Cha Cha Cha Law has extensive experience representing families after fatal accidents. Contact our attorneys to discuss a wrongful‑death claim.
Time‑of‑Day Trends: When Do Most Crashes Happen in Los Angeles?
Los Angeles traffic flows change dramatically over the course of the day. Los Angeles Department of Transportation data show that:
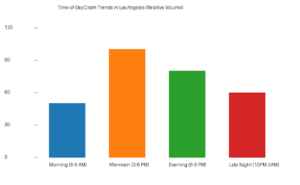
- Afternoon rush hour (3 PM – 6 PM) has the highest crash volume. Heavy congestion and drivers rushing home contribute to collisions.
- Evening (6 PM – 9 PM) is when fatal or severe‑injury crashes peak. Reduced daylight and tired drivers play a role.
- Late-night (10 PM – 2 AM) crashes often involve impaired driving; weekends see especially high rates.
- Weekdays, especially Tuesdays and Fridays, have more crashes during the 3 PM – 5:59 PM window.
The bar chart below visualizes these time‑of‑day patterns (relative volumes based on the available data).
Speeding, DUI and Other Contributing Factors
Traffic deaths are not just about total volume; specific behaviors exacerbate crash severity:
- Alcohol‑related and DUI crashes: Amendt Law estimates that over 6,300 injuries or deaths in LA County in 2024 involved impaired drivers. Late‑night collisions often involve alcohol or drugs.
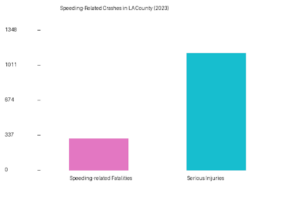
- Speeding: A SafeTREC review of 2023 data found that Los Angeles County had 299 speeding‑related fatalities and 1,124 serious injuries, the highest counts of any California county.
The chart below illustrates the disparity between deaths and serious injuries from speeding.
- Distracted driving: Injuries related to distracted driving fell 41% from 2020 to 2024, but distracted drivers still cause thousands of collisions.
- Hit‑and‑run crashes: Fatal hit‑and‑runs accounted for 106 deaths in 2023, a 23% increase from the previous year.
If you were hit by a speeding, drunk or distracted driver, you deserve justice. Call Cha Cha Cha Law at (213) 351‑3513 for a free, no‑obligation consultation.
Los Angeles’ Most Dangerous Intersections
Crash data, attorney analyses and local news coverage identify numerous Los Angeles intersections as particularly hazardous. Below is a curated list of no more than 25 intersections drawn from multiple sources. These locations experience high crash volumes, frequent injuries and dangerous driver behavior. Many also sit along busy transit corridors.
| Intersection | Area | Why it’s dangerous |
|---|---|---|
| Hollywood Blvd & Highland Ave | Hollywood | Heavy tourism and turning traffic, frequent side‑impact collisions |
| Sunset Blvd & Highland Ave | Hollywood | High speeds and complex signal timing; nightlife crowds |
| Vermont Ave & Wilshire Blvd | Koreatown | Busy bus hub with numerous left‑turns; pedestrian and cyclist conflicts |
| Van Nuys Blvd & Roscoe Blvd | Panorama City | High traffic density; large volumes of turning vehicles |
| Sepulveda Blvd & Burbank Blvd | Sherman Oaks | Major north–south artery meets east–west arterial; frequent rear‑end collisions |
| Sherman Way & Sepulveda Blvd | Van Nuys | Commercial corridor with heavy truck and bus traffic |
| Slauson Ave & Western Ave | South LA | Dense residential and retail area; speeding and stop‑sign violations |
| Florence Ave & Figueroa St | South LA | Multiple freeway ramps converge; high pedestrian activity |
| Crenshaw Blvd & Manchester Ave | South LA | Long signal cycles encourage red‑light running near freeway entrance |
| Lincoln Blvd & Venice Blvd | Venice | Tourist area near the beach; mix of cars, bikes and scooters |
| Alvarado St & Sunset Blvd | Echo Park/Westlake | Steep grade and curve; high speeds and pedestrian crossings |
| Santa Monica Blvd & Highland Ave | West Hollywood | Congested corridor near nightlife; frequent side‑swipes |
| Devonshire St & Reseda Blvd | Northridge | High crash and injury counts |
| Imperial Hwy & Vista Del Mar | Playa Del Rey | Intersection of busy highway and beach road; 26 crashes & 39 injuries |
| Balboa Blvd & Nordhoff St | Northridge | 26 crashes & 37 injuries |
| Firestone Blvd & Lakewood Blvd | Downey (L.A. County) | Very high crash counts, 36 crashes & 32 injuries in (2015) |
| Lindley Ave & Roscoe Blvd | Northridge | 16 crashes & 31 injuries, including 2 fatalities (2015) |
| Slauson Ave & South Figueroa St | South LA | LAPD data show 66 serious collisions and 17 felony hit‑and‑run crashes over four years |
Frequently Asked Questions (FAQs)
1. How common are car accidents in Los Angeles?
Car accidents are extremely common in Los Angeles due to the region’s large population and heavy traffic. Los Angeles County records tens of thousands of crashes involving injuries every year, making it one of the highest-risk areas for collisions in California.
2. How many people die in car accidents in Los Angeles each year?
Recent data shows that hundreds of people die in traffic collisions in the City of Los Angeles each year. For example, about 302 traffic fatalities were recorded in 2024, demonstrating that vehicle crashes remain one of the leading causes of accidental death in the city.
3. How many crashes occur in Los Angeles County annually?
Los Angeles County experiences more than 58,000 crashes involving death or injury each year, according to recent reports. These collisions resulted in over 650 fatalities in a recent reporting year, highlighting the serious risks drivers face on local roads.
4. Why does Los Angeles have so many car accidents?
Several factors contribute to the high number of accidents in Los Angeles, including:
- Heavy traffic congestion
- Long daily commutes
- Distracted driving (phones and navigation devices)
- Speeding and aggressive driving
- Driving under the influence of alcohol or drugs
Urban density and complex road networks also increase the likelihood of collisions.
5. What are the most common causes of car accidents in Los Angeles?
Some of the most common causes of crashes include:
- Distracted driving
- Speeding
- DUI (driving under the influence)
- Running red lights
- Unsafe lane changes
- Following too closely
Many serious accidents involve a combination of these factors.
6. Are pedestrians and cyclists at high risk in Los Angeles?
Yes. Pedestrians and cyclists are among the most vulnerable road users in Los Angeles. In recent years, over half of fatal traffic collisions involved pedestrians, highlighting the importance of road safety and driver awareness.
7. What should I do after a car accident in Los Angeles?
If you are involved in a car accident, you should:
- Call 911 and report the collision
- Seek medical attention for any injuries
- Exchange information with the other driver
- Take photos of the accident scene
- Obtain a police report
- Speak with a personal injury attorney before dealing with insurance companies
Taking these steps can help protect both your health and your legal rights.
8. When should I contact a personal injury lawyer after a car accident?
You should consider contacting a personal injury lawyer as soon as possible after an accident, especially if:
- You were injured
- Liability is disputed
- The insurance company denies or undervalues your claim
- Medical bills or lost wages are significant
An attorney can help investigate the crash, gather evidence, and pursue compensation.
What Do These Numbers Mean for You?
Car crashes in Los Angeles are not just statistics. Each injury and fatality represents a person whose life has been changed forever. Understanding where and when crashes occur can help you stay alert, but no amount of caution can control other drivers’ behavior. If you’re hurt because someone else drove recklessly, you have the right to seek compensation for your medical bills, lost wages, and pain.
Cha Cha Cha Law handles auto accident cases throughout the Los Angeles area. We know how to investigate collisions, identify liable parties, and negotiate with insurance companies. Call us at (213) 351‑3513 or use our online form for a free consultation.